

plot - 2 boyutlu çizim yapan fonksiyon
plot(x,y,'c+:') c=renk, +=işaret, :=çizgiBirden fazla grafiksel çizim yapılabilir
plot(x,y,'y-',X,Y,'go')% Örnek 1
figure(1)
x=linspace(-2,2,40) % -2 den 2 ye kadar eşit artımlı 40 değer oluşturur
y=exp(-x)
z=x.*x
plot(x,y,'b*',x,z,'r+')

% Örnek 2 - Aynı işlemi farklı şekilde yapabiliriz
figure(2)
x=linspace(-2,2,40);
w=[exp(-x); x.*x]
plot(x,w)

Hold on/off arasında bulunan plot komutlarının hepsini işleme sokar. Aynı altlıkta çizimi gerçekleştirir.
% Örnek 3
figure(3)
hold on
plot(x,y,'b*')
plot(x,z,'r*')
hold off

% Örnek 4
figure(4)
plot(x,y,'b*')
plot(x,z,'r*') % ilk komutu figure(4) e çizdirir. hold komutu kullanılmadan ikinci komut girilince eski komutu temizleyerek yeni komutu çizer.

title - çizime başlık ekleme
label - çizime açıklama ekleme
% Örnek 5
figure(5)
x=linspace(-2,2,40);
y=exp(-x);
z=x.*x;
plot(x,y,'b*',x,z,'r+')
title('exp(-x) ve x.*x grafikleri');
xlabel('x değerleri');
ylabel('y değerleri');

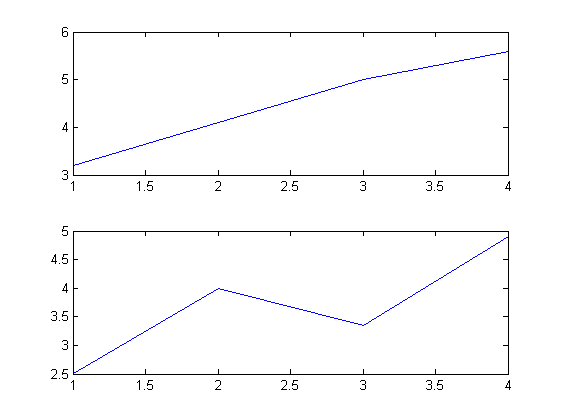
subplot - birden fazla çizimi tek pencerede gösterme
% Örnek 6
figure(6)
a=[3.2 4.1 5.0 5.6]
b=[2.5 4.0 3.35 4.9]
subplot(2,1,1); plot(a);
subplot(2,1,2); plot(b);
% Örnek 7
figure(7)
c=[logspace(-2,2,4)]
subplot(2,2,1:2); plot(a);
subplot(2,2,3); plot(b);
subplot(2,2,4); plot(c);

% Örnek 8
figure(8)
subplot(2,2,[1 3]); plot(a); % 2 satır 2 sütun, 1. ve 3. satırları birleştirerek çiz.
subplot(2,2,2); plot(b); % 2 satır 2 sütun, 2.satırı çiz.
subplot(2,2,4); plot(c); % 2 satır 2 sütun, 4. satırı çiz.

close all - açılan tüm çizim ya da işlem ekranlarını tek bir seferde kapatma
Command Window (Komut Penceresi):
x =
Columns 1 through 11
-2.0000 -1.8974 -1.7949 -1.6923 -1.5897 -1.4872 -1.3846 -1.2821 -1.1795 -1.0769 -0.9744
Columns 12 through 22
-0.8718 -0.7692 -0.6667 -0.5641 -0.4615 -0.3590 -0.2564 -0.1538 -0.0513 0.0513 0.1538
Columns 23 through 33
0.2564 0.3590 0.4615 0.5641 0.6667 0.7692 0.8718 0.9744 1.0769 1.1795 1.2821
Columns 34 through 40
1.3846 1.4872 1.5897 1.6923 1.7949 1.8974 2.0000
y =
Columns 1 through 11
7.3891 6.6688 6.0187 5.4320 4.9025 4.4246 3.9933 3.6040 3.2527 2.9356 2.6495
Columns 12 through 22
2.3912 2.1581 1.9477 1.7579 1.5865 1.4319 1.2923 1.1663 1.0526 0.9500 0.8574
Columns 23 through 33
0.7738 0.6984 0.6303 0.5689 0.5134 0.4634 0.4182 0.3774 0.3406 0.3074 0.2775
Columns 34 through 40
0.2504 0.2260 0.2040 0.1841 0.1661 0.1500 0.1353
z =
Columns 1 through 11
4.0000 3.6003 3.2216 2.8639 2.5273 2.2117 1.9172 1.6437 1.3912 1.1598 0.9494
Columns 12 through 22
0.7600 0.5917 0.4444 0.3182 0.2130 0.1289 0.0657 0.0237 0.0026 0.0026 0.0237
Columns 23 through 33
0.0657 0.1289 0.2130 0.3182 0.4444 0.5917 0.7600 0.9494 1.1598 1.3912 1.6437
Columns 34 through 40
1.9172 2.2117 2.5273 2.8639 3.2216 3.6003 4.0000
w =
Columns 1 through 11
7.3891 6.6688 6.0187 5.4320 4.9025 4.4246 3.9933 3.6040 3.2527 2.9356 2.6495
4.0000 3.6003 3.2216 2.8639 2.5273 2.2117 1.9172 1.6437 1.3912 1.1598 0.9494
Columns 12 through 22
2.3912 2.1581 1.9477 1.7579 1.5865 1.4319 1.2923 1.1663 1.0526 0.9500 0.8574
0.7600 0.5917 0.4444 0.3182 0.2130 0.1289 0.0657 0.0237 0.0026 0.0026 0.0237
Columns 23 through 33
0.7738 0.6984 0.6303 0.5689 0.5134 0.4634 0.4182 0.3774 0.3406 0.3074 0.2775
0.0657 0.1289 0.2130 0.3182 0.4444 0.5917 0.7600 0.9494 1.1598 1.3912 1.6437
Columns 34 through 40
0.2504 0.2260 0.2040 0.1841 0.1661 0.1500 0.1353
1.9172 2.2117 2.5273 2.8639 3.2216 3.6003 4.0000
a =
3.2000 4.1000 5.0000 5.6000
b =
2.5000 4.0000 3.3500 4.9000
c =
0.0100 0.2154 4.6416 100.0000
Published with MATLAB® 7.10
Yorum Gönder
Yorumlama biçimi: Anonim seçerek yorumlarınızı yapabilirsiniz.